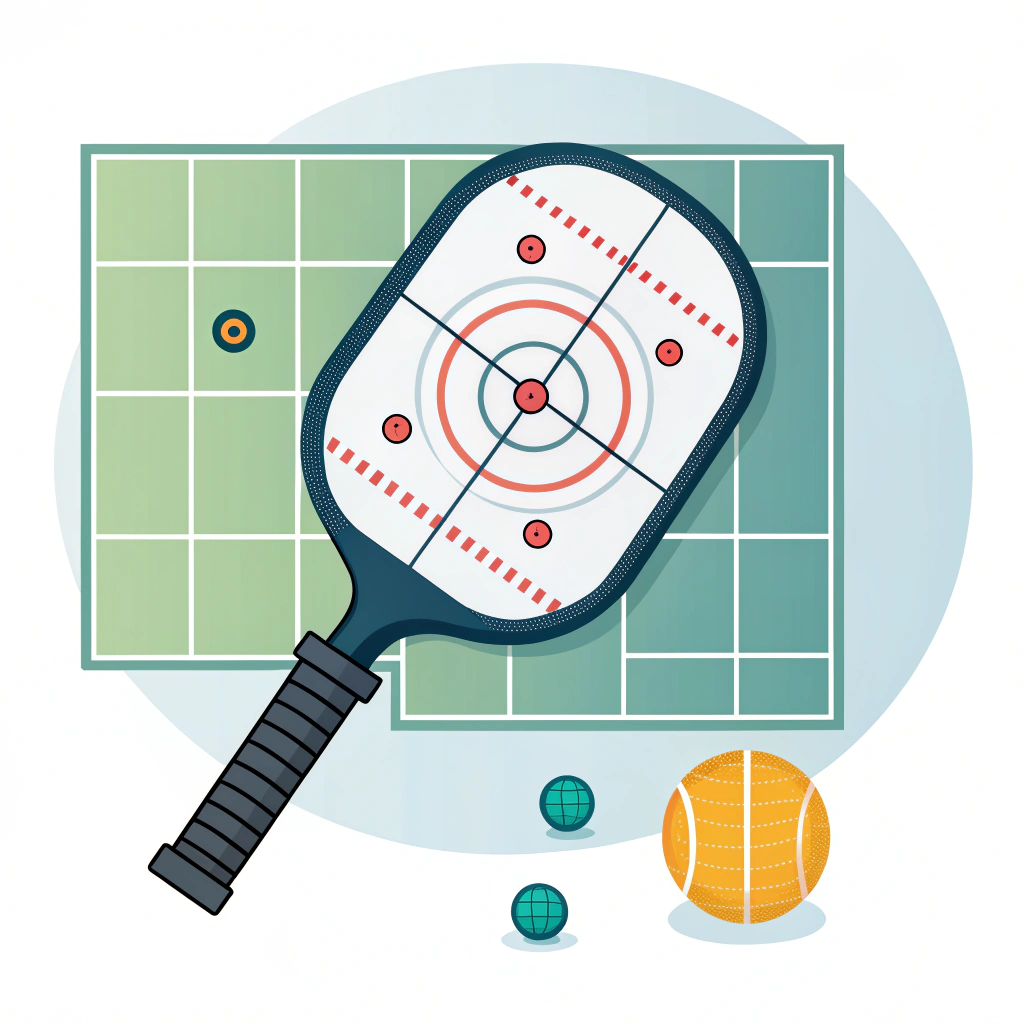
Short answer: a larger sweet spot1 improves forgiveness and shot-to-shot consistency—especially for recreational and transitional players—but it usually trades off some peak power and spin potential. Sweet-spot size is a system-level outcome driven by face material2 stiffness, core material and thickness, paddle geometry and weight distribution, and the chosen manufacturing process (hot pressing, cold pressing, thermoforming3). Specify measurable sweet-spot metrics and acceptance tests to align R&D, procurement and manufacturing expectations.
For a product manager or purchasing director, sweet-spot sizing is not just a player comfort metric. It directly affects:
- Product positioning (power vs. control vs. forgiveness)
- Return and warranty exposure from “poor feel” complaints
- Materials and process choices that drive COGS and lead time
- QC complexity and testing time (and therefore unit cost)
A clear, testable sweet-spot target (area, off-center performance curve, and repeatability) lets you compare suppliers objectively and reduce subjective “feel” disputes during sampling.
Sweet-spot behavior emerges from several interacting factors:
- Face material stiffness and layup: 3K carbon fiber, 12K carbon fiber, T300 carbon fiber, and E‑Glass fiberglass differ in stiffness, damping and surface smoothness. Stiffer faces concentrate the high-velocity rebound near the geometric center; more damped faces spread response, enlarging the apparent sweet spot.
- Core material and thickness: honeycomb core (polymer, aluminum or Nomex) stiffness, thickness and cell structure control bending stiffness and energy transfer. Thicker/softer cores tend to increase the forgiving area but reduce peak rebound.
- Geometry and sweet-spot mapping: face width, length, and edge radius influence how energy couples into the rim and handle. Elongated shapes move the high-velocity centroid away from geometric center (affects reach more than sweet spot).
- Weight distribution / balance (MOI4): higher moment of inertia around the handle tends to “stabilize” off-center hits, increasing perceived sweet spot but shifting feel.
- Surface texture & spin: micro-texture affects contact time and friction; textured faces (light embossing) can slightly alter effective sweet-spot boundaries by changing local energy absorption.
- Manufacturing process: hot pressing, cold pressing, and thermoforming change resin flow, fiber consolidation and face-to-core bonding—affecting stiffness uniformity and therefore sweet-spot consistency across batches.
First occurrences of important terms above are bolded for clarity.
To make supplier specs meaningful, convert “bigger sweet spot” into measurable metrics. Recommended test matrix:
-
Sweet-spot map (grid impact test)
- Mount paddle on a rigid fixture replicating handle constraint.
- Use a calibrated linear actuator and ball launcher to impact a 1 cm grid across the face.
- Measure peak ball rebound velocity (or coefficient of restitution, COR5), peak acceleration at handle (vibration), and dwell time.
- Define sweet-spot area as contiguous grid cells within X% of center COR (typical X = 90% for “consistent feel” spec).
-
Off-center performance curve
- Report COR (or outgoing ball speed) vs. radial offset in mm from the center.
- Provide values at 10mm, 20mm, 30mm offsets. Example spec: max -10% COR at 20mm offset; max -25% at 30mm offset.
-
Vibration and shock metrics
- Measure peak acceleration and dominant frequency at handle for center vs. off-center hits (ISO-style accelerometer).
- Set acceptance: off-center peak acceleration ≤ Y% above center (improves perceived forgiveness).
-
Durability & consistency
- Cycle test: 10,000 impacts at center and two off-center locations. Report change in COR and cosmetic damage.
- Batch-to-batch variance: sample size N≥10; report mean ± standard deviation for center COR and sweet-spot area.
Suggested primary KPIs to include in purchase specification:
- Sweet-spot area (cm²) at ≥90% center COR
- COR at center (and at 10/20/30mm)
- Handle peak acceleration difference (off-center vs center) %
- Batch mean ± SD for center COR
Choose the process that matches your product goals and allowable cost/time.
| Process | Effect on sweet spot | Pros | Cons | Best for |
|---|---|---|---|---|
| Hot pressing | Uniform consolidation, can produce stiff, responsive faces — tends to produce smaller peakier sweet spots but very consistent batch control when optimized | High throughput; strong fiber-resin bond; durable | May change material damping; equipment cost high | High-volume competitive paddles where durability & consistency matter |
| Cold pressing | Preserves material damping -> broader, more forgiving sweet spot | Better feel; retains fiber properties | Longer cycles; requires tight pressure control | Touch/control paddles, mid-volume OEM runs |
| Thermoforming | Good for complex geometry and targeted thickness distribution; can enlarge sweet spot by localizing thickness | Enables tailored sweet-spot shaping | Slower; higher tooling cost | Premium/custom products, complex shapes |
Manufacturers should provide trial runs and cross-section samples to validate local material distribution—this directly correlates to measured sweet-spot maps.
Below is a practical mapping to help translate marketing claims into engineering expectations.
| Face Material | Core Type | Typical sweet-spot behavior | Playable tradeoffs |
|---|---|---|---|
| 3K Carbon Fiber | Polymer honeycomb (thin) | Medium sweet spot; high responsiveness | Good balance of power & control |
| 12K Carbon Fiber | Polymer or aluminum honeycomb | Smaller, peakier sweet spot; very durable | High power and impact resistance; less forgiving |
| T300 Carbon Fiber | Nomex honeycomb | High stiffness, focused sweet spot | Competition-level power; higher price |
| E‑Glass Fiberglass | Polymer honeycomb (thicker) | Larger sweet spot; more damping | Better control/forgiveness; less top-end power |
| Carbon + Fiberglass composite | Polymer or bamboo core | Broad sweet spot with decent power | Balanced choice for mid-to-high performance |
| Face + Bamboo core | Bamboo core composite | Clear feel; moderate sweet spot | Lightweight, long-lasting feel; custom segment |
Use this when deciding which paddle models to position for target customer segments.
If the brief is “maximise sweet spot while retaining acceptable power,” these are the levers to consider—each with procurement implications:
- Increase face area (wider paddle)
-
- Larger sweet-spot area
-
- Adds swing weight; may require rebalancing
-
- Move to more damped face layup (E‑Glass or hybrid)
-
- Broadens forgiveness
-
- Reduces top-end COR; may impact retail positioning vs “power” paddles
-
- Increase core thickness or use softer polymer honeycomb
-
- Greater energy spread and damping -> bigger sweet spot
-
- Can reduce stiffness and perceived “pop”
-
- Raise MOI via mass distribution toward the head
-
- Stabilizes off-center hits
-
- May make paddle feel heavy in swings
-
- Localized thickness control (thermoforming)
-
- Tailor sweet-spot shape without uniformly sacrificing power
-
- Higher tooling costs and longer lead times
-
Each change must be validated with the measurement battery above and communicated to manufacturing with tolerances.
- Target product class: Control / Balanced / Power
- Face: [material, e.g., 3K carbon fiber, epoxy system, layup schedule]
- Core: [type, e.g., polymer honeycomb 12mm nominal]
- Geometry: length X mm, width Y mm, edge radius Z mm
- Target weight: 200 ± 4 g (or range per SKU)
- Balance point: distance from butt to center of mass ± 2 mm
- Sweet-spot acceptance:
- Center COR: 0.XX ± 0.01 (specify test method ISO/ball speed)
- Sweet-spot area: ≥ XX cm² where COR ≥ 90% of center
- COR drop: ≤ 10% at 20 mm offset; ≤ 25% at 30 mm offset
- Vibration: handle peak acceleration difference (20mm off-center vs center) ≤ 30%
- Durability: ≤ 5% COR degradation after 10k center impacts
- Visual: no surface delamination, no bubbling after 72-hour humidity test
- Batch sampling: N=10; report mean ± SD for center COR and sweet-spot area
- Process preference: [hot press / cold press / thermoform] with sample cross-sections and press parameter logs
- Customization: on-demand print capability CMYK + white base, registration tolerance ±0.5 mm
Include supplier obligation to run the sweet-spot mapping test and deliver raw CSV of impact grid data for audit.
- Cold-pressed control paddles: higher unit cost, longer lead-time, easier to meet forgiving sweet-spot specs.
- Hot-pressed power paddles: cost efficient at scale, more consistent structural properties, but achieving a large forgiving sweet spot may require composite tweaks (hybrid faces) or geometry changes.
- Thermoforming: best for premium customized placements (local thickness), but plan for tooling lead-time and higher NRE.
Negotiate sample validation runs (paid PILOT batches) with explicit KPI acceptance gates and price re-negotiation points when targets are met.
- If target user = recreational or club-level players: prioritize larger sweet spot, choose E‑Glass or hybrid face with thicker polymer honeycomb; prefer cold pressing or controlled thermoforming.
- If target user = advanced/competitive: prioritize peak power and spin, go with T300 or 12K carbon faces and thinner, stiffer honeycomb; hot pressing acceptable for consistent batches.
- If targeting multi-SKU lineup: standardize on a common core and vary face layup/geometries to control sweet-spot vs power across SKUs—this reduces tooling and QC complexity.
- Convert “bigger sweet spot” into testable KPIs: sweet-spot area at ≥90% center COR, COR vs offset, and handle vibration deltas.
- Choose material/process based on desired product class; document tradeoffs for R&D and procurement.
- Require supplier-run sweet-spot mapping and provide raw data; include batch variance limits in contract.
- Pilot at small volume with agreed acceptance gates before scaling production.
These steps reduce subjective sampling rounds and align procurement, engineering and suppliers on a measurable definition of performance.
People Also Ask
Q: Is a bigger pickleball paddle better?
A: It depends on the player and the goal. A larger sweet spot increases forgiveness and consistency, making it better for recreational or developing players. However, larger or more forgiving paddles often reduce peak power and spin compared to stiffer, thinner designs favored by advanced players. Choose based on targeted player skill and product positioning.
Q: What makes some pickleball paddles better than others?
A: “Better” depends on prioritized performance: materials (face and core), geometry and manufacturing determine control, power, durability and feel. Key factors include face material (carbon fiber vs fiberglass), core type (polymer/honeycomb, Nomex, aluminum, or bamboo), core thickness, and production method (hot pressing, cold pressing, thermoforming). Power-focused paddles usually have stiffer faces and thinner cores (smaller sweet spot, higher feedback); touch-focused paddles use more damping and thicker cores for a larger sweet spot and forgiveness.
-
larger sweet spot: Read to understand the practical tradeoffs between forgiveness and peak performance, how sweet-spot area impacts warranty/returns, and how to translate “larger” into measurable supplier specs for procurement and R&D. ↩
-
face material: Read to compare weave types, stiffness vs damping, layup choices and supply-chain implications (cost, lead time, QC) so you can specify face materials with clear performance expectations. ↩
-
thermoforming: Read to understand thermoforming’s ability to localize thickness and shape sweet-spot geometry, plus the tooling, lead-time and cost tradeoffs relevant to procurement. ↩
-
MOI: Read to learn how moment of inertia (balance and mass distribution) changes perceived forgiveness and stability, plus how to measure and specify MOI-related limits in OEM requirements. ↩
-
COR: Read to get a practical guide to coefficient-of-restitution testing (setups, calibration, metrics) and how to use COR curves for acceptance criteria and supplier comparisons. ↩


