Skip to content
A quick answer: Effective measurement of production KPIs in pickleball manufacturing allows you to optimize cycle time, ensure quality control, and boost overall manufacturing efficiency by using targeted metrics and process improvements.
Pickleball production is a specialized area of sports equipment manufacturing that requires a close look at every production stage. Production managers and operations experts must track key performance indicators (KPIs1) to ensure the highest standard of paddle quality, efficiency, and cost management. In today’s competitive B2B environment, understanding and leveraging production KPIs is essential to drive operational excellence and maintain a competitive edge.
With the growing demand for high-performance pickleball paddles, manufacturers such as NEX Pickleball need to balance production speed with quality control. This balance can be challenging as high production volumes may lead to increased scrap rate, extended cycle times, or even compromise the precision required in paddle design. Insightful KPI tracking not only pinpoints inefficiencies but also provides a framework for continuous process optimization.
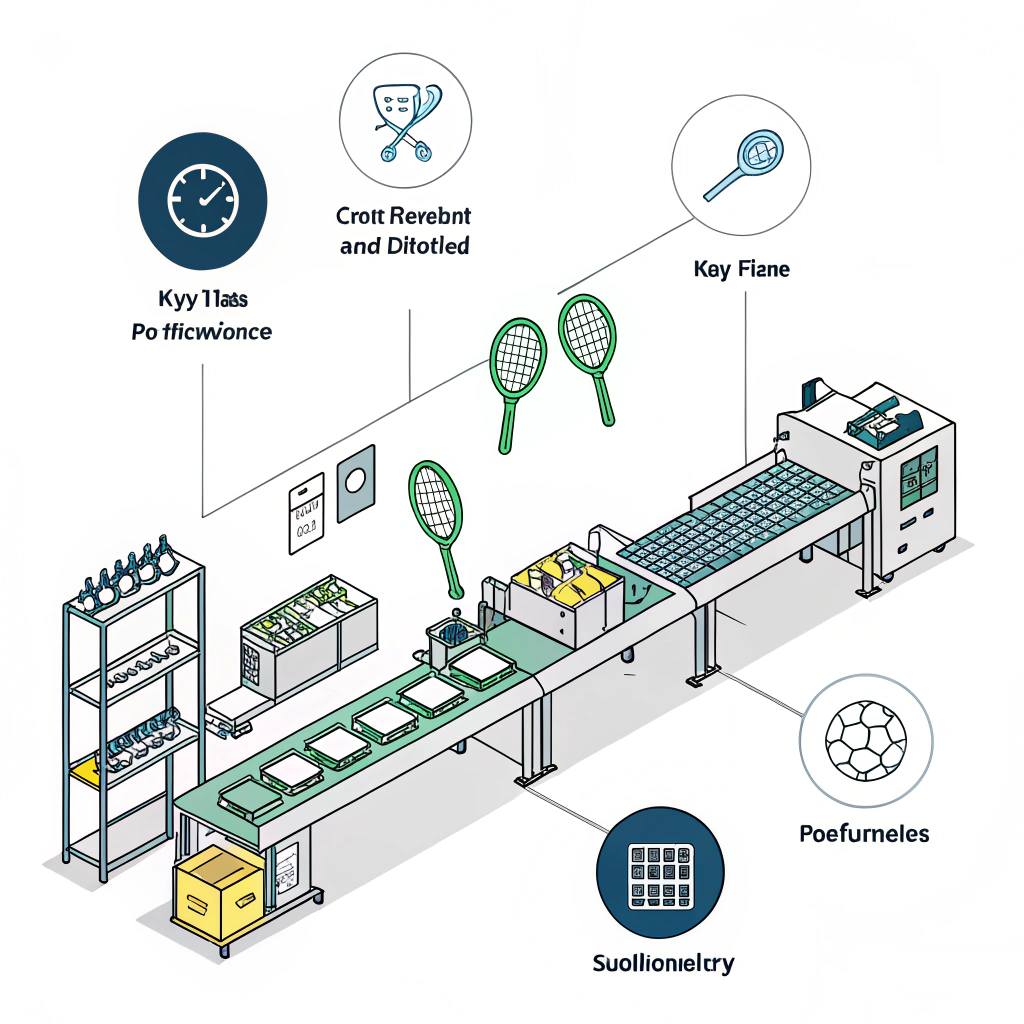
Pickleball paddles are not simple products. They involve advanced materials2—from varied types of carbon fiber like 3K, 12K, and T300 to fiberglass and composite materials—as well as complex production methods such as hot pressing, cold pressing, and thermoforming. Each process has its inherent advantages and disadvantages, making it critical to monitor and optimize every aspect of production.
When managing diverse materials and production techniques, common challenges include:
- Material Variation: Different carbon fibers and composite structures have unique behaviors during pressing and curing.
- Process Consistency: Maintaining uniform quality across high-volume production while transitioning between production modes.
- Quality Assurance: Ensuring every paddle meets the required performance metrics without compromise.
- Cycle Time Optimization: Balancing production speed and meticulous manufacturing details.
Several root causes contribute to operational inefficiencies in pickleball production:
- Inadequate Data Collection: Without real-time data, it is difficult to pinpoint which stage is causing delays or variations.
- Process Variability: Differences in production techniques can lead to inconsistent paddle quality.
- Equipment Limitations: Outdated or improperly calibrated equipment can slow down production and reduce overall equipment effectiveness (OEE).
- Human Factors: Operator errors or uneven adherence to production protocols may further contribute to production slowdowns or increased scrap rates.
By understanding these challenges, production managers can identify specific KPIs that will provide actionable insights for process optimization.
To tackle these challenges, it is crucial to focus on the most relevant KPIs that reflect process efficiency, quality, and cost-effectiveness. Below is a detailed list of key KPIs along with their significance:
| KPI | Definition | Significance | Example Measurement |
|---|---|---|---|
| Overall Equipment Effectiveness (OEE)3 | Combines availability, performance, and quality | Indicates how well production assets are utilized | 75%-85% for best-in-class operations |
| Cycle Time4 | Time taken to complete one production cycle | Helps identify production bottlenecks | Measured in seconds or minutes |
| Scrap Rate | Percentage of materials wasted during production | Reflects process quality and material efficiency | 2%-5% for mature processes |
| Yield | Ratio of acceptable outputs to total production | A high yield indicates efficient and effective production | 90%-98% in optimized lines |
| Downtime | Total time where production is halted | Directly impacts production volume and cost | Measured in hours per day or shifts |
| First Pass Quality (FPQ)5 | Rate of products meeting quality standards on first pass | Reduces rework costs and enhances client satisfaction | Percentage of defect-free products |
Each of these KPIs plays a critical role in ensuring that every stage of the production process is aligned with operational goals.

The first step in using KPIs effectively involves setting clear objectives. A production manager should ask:
- What is the target cycle time for each paddle?
- What levels of scrap rate and yield are acceptable?
- How is equipment performance influencing overall throughput?
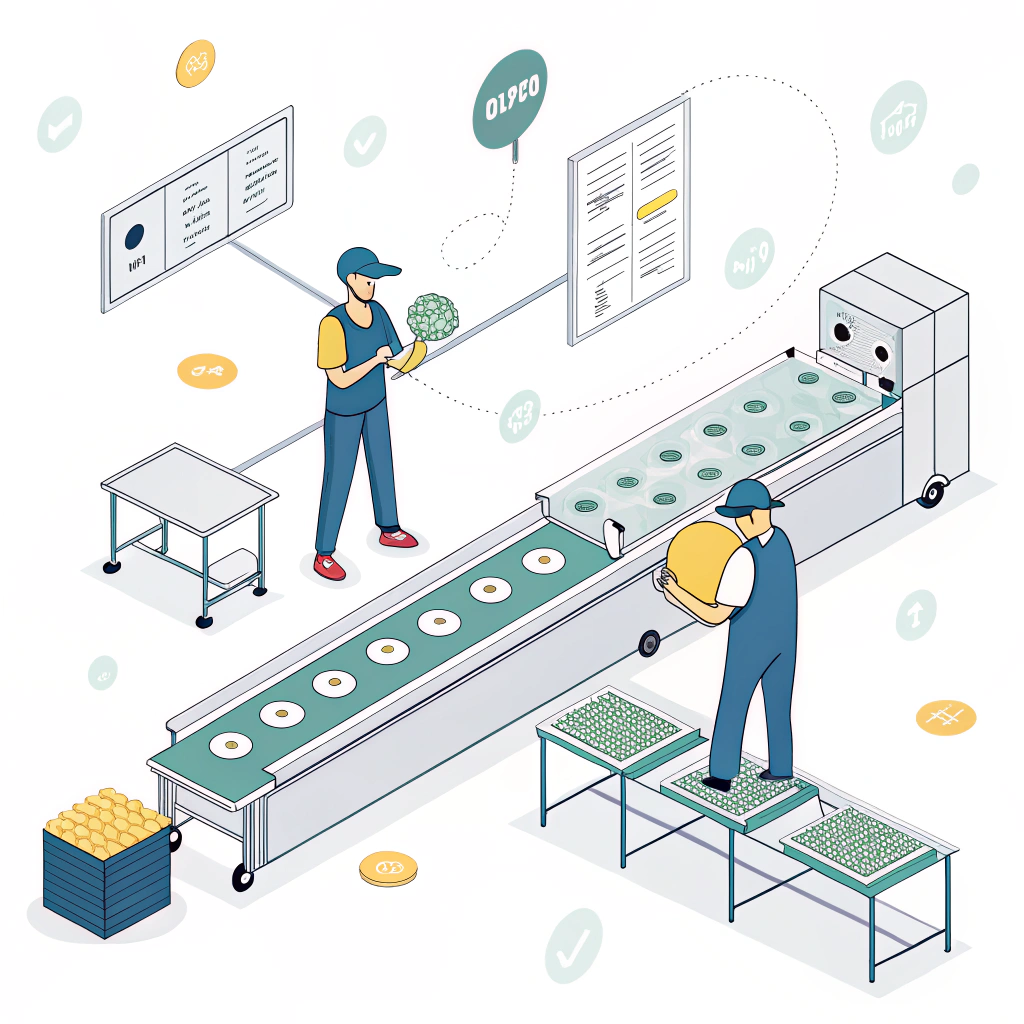
Mapping out each stage of production—from material handling and pressing (hot, cold, or thermoforming) to finishing—will help identify critical control points.
A critical element in leveraging KPIs is data. Invest in monitoring systems that capture:
- Real-time production data: Tracking cycle times and downtime through automated sensors.
- Quality control checkpoints: Recording FPQ measurements and scrap rates at regular intervals.
- Equipment performance logs: Monitoring OEE and any incidents of machine downtime.
A centralized dashboard can integrate this data, offering a live overview of production performance. This data visualization fosters quicker decision-making and immediate corrective actions when metrics deviate from set standards.
Once data is collected, analyze it against internal benchmarks and industry standards:
- Compare cycle times across different production batches.
- Benchmark OEE results against established norms.
- Use trend analysis to check if scrap rates are increasing or yield is declining over time.
Regular meetings with production teams can help contextualize these numbers and determine if observed issues are process-related or a result of external factors such as supply chain inconsistencies.
Based on the analysis, you can create a checklist of process improvements. Consider the following improvement plan:
- Streamline the material handling process to reduce cycle time.
- Upgrade or recalibrate equipment to enhance overall equipment effectiveness.
- Enhance operator training to reduce errors during production.
- Adopt lean manufacturing practices to minimize waste and improve yield.
- Introduce periodic equipment maintenance routines to lower unplanned downtime.
Below is an example checklist in tabular format for quick reference:
| Improvement Action | Expected Impact | Responsible Team | Timeline |
|---|---|---|---|
| Upgrade monitoring systems | Real-time data capture | IT/Operations | 2 months |
| Optimize machine calibration | Reduced cycle time | Maintenance | 1 month |
| Lean training for operators | Lower scrap and better FPQ | HR/Production | 3 months |
| Implement regular equipment maintenance | Increase OEE and reduce downtime | Maintenance/Operations | Ongoing |
Different production processes offer unique advantages. For example, hot pressing ensures high production efficiency and structural integrity, ideal for competitive play paddles. In contrast, cold pressing provides greater control over the paddle’s surface feel. Understanding these differences helps select the right approach depending on your production priorities.
In a dynamic manufacturing environment, real-time adjustments can greatly enhance efficiency. Integrated production software allows managers to:
- Monitor cycle time and adjust workflow in real time.
- Identify deviations from benchmarks, such as an unexpected increase in scrap rate.
- Make swift decisions to shut down a line for calibration or maintenance if performance dips.
It is important to remember that faster production isn’t always better if it compromises quality. Maintaining balance involves:
- Regularly reviewing First Pass Quality (FPQ) data.
- Adjusting cycle times without rushing the process.
- Continually training personnel on quality assurance protocols.

Even the most efficient production line can suffer if human errors are not minimized. Emphasize:
- Detailed documentation of production processes.
- Cross-functional training so that operators can quickly adapt to different production methods.
- Implementing feedback loops where operator insights are evaluated for further process improvements.
Consider a leading pickleball paddle manufacturer that recently overhauled their production lines by focusing on KPI-driven improvements. Prior to the changes, the factory faced a scrap rate of 7% and a cycle time that was significantly above the industry average, resulting in lost revenue and dissatisfied buyers.
Steps taken included:
- Implementing a high-precision data collection system to monitor cycle times and equipment downtime.
- Conducting detailed operator training sessions on lean manufacturing principles.
- Recalibrating machinery to optimize the overall equipment effectiveness (OEE).
After a six-month period, the manufacturer reported:
- A scrap rate reduction to 3%, saving both material costs and reducing environmental waste.
- A decrease in cycle time by 20%, which translated into increased throughput and faster delivery times.
- Improved FPQ rates, ensuring that more than 95% of paddles passed quality control on the first production pass.
Such real-world examples underscore the value of well-chosen KPIs in driving continual process improvements.
In summary, using clear and measurable KPIs is crucial for optimizing pickleball production. By focusing on metrics like Overall Equipment Effectiveness (OEE)3, Cycle Time4, scrap rate, yield, and First Pass Quality (FPQ)5, production managers can:
- Identify production inefficiencies.
- Implement data-driven improvements.
- Enhance overall production quality and delivery times.
Production KPI monitoring methods should be iterative and adaptive. Managers are encouraged to:
- Regularly review performance data.
- Adjust processes based on real-time metrics.
- Continually train staff and update equipment.
If your goal is to sustain a competitive advantage in the B2B manufacturing market, consider integrating these KPI-based strategies into your operational processes. For further insights or personalized consultations, reach out to experts who can tailor solutions specific to your production needs.
Q1: What are the most important KPIs to measure in pickleball production?
A1: The key KPIs include Overall Equipment Effectiveness (OEE), cycle time, scrap rate, yield, downtime, and first pass quality. These metrics help identify inefficiencies, optimize production cycles, and maintain high product quality across various manufacturing stages.
Q2: How can production managers reduce cycle time in paddle manufacturing?
A2: Reducing cycle time involves mapping production processes, improving real-time data collection, recalibrating equipment, and implementing lean manufacturing practices. Regular process reviews and targeted training for operators also play a significant role.
Q3: What techniques improve quality control in pickleball manufacturing?
A3: Enhancing quality control can be achieved by tracking First Pass Quality (FPQ), setting up regular quality checkpoints, implementing automated monitoring systems, and continuously training staff. These practices ensure that high standards are maintained without compromising production speed.
-
KPIs: Click here to explore an in-depth guide on identifying and utilizing key performance indicators to optimize production processes and drive operational excellence in manufacturing. ↩
-
Advanced Materials: Click here to learn more about modern composite and carbon fiber materials, including their properties and applications in high-performance manufacturing. ↩
-
Overall Equipment Effectiveness (OEE): Click here to understand how OEE quantifies manufacturing productivity by measuring equipment availability, performance, and quality, and how to improve it. ↩ ↩2
-
Cycle Time: Click here to explore the importance of cycle time in production, methods to measure it, and strategies to reduce it for efficient manufacturing operations. ↩ ↩2
-
First Pass Quality (FPQ): Click here to read further on FPQ, its role in quality assurance, and techniques to achieve high defect-free production rates. ↩ ↩2